An Analysis of Tweets About the Earthquake in Mexico
On Tuesday 19th September, a magnitude 7.1 earthquake hit Mexico, causing serious damage in and around Mexico City and Morelos and Puebla states.
In Mexico City, at the time of writing, there were reports of at least 180 dead and nearly 40 collapsed buildings, as well as hundreds or even thousands more structures with bad enough damage that will almost certainly mean that they have to be knocked down.
This was the worst earthquake to hit Mexico since one that, in a tragic coincidence, took place 32 years ago to-the-day in 1985.
One big difference between what happened in 1985 and the last few days has been that the vast majority of people have experienced recent events through digital media, and in particular social networks.
I have spoken with a number of people about their recollections of 1985, and pretty consistently they talk about how hard it was to know what was happening in different parts of the city. In contrast, during the past week it has been almost impossible not to be surrounded by 24-hour coverage of events.
Social Networks - A blessing or a curse?
In many ways social networks along with messaging apps have played a critical role in the reaction to and management of this disaster, at least in Mexico City.
During the immediate aftermath of the earthquake, phone lines were either saturated or just not working, and for many people WhatsApp and Facebook provided the only option for getting-in-touch with loved ones and friends.
Later on, once the scale of damage and destruction became clear, people began to use Twitter and Facebook to send messages about people and buildings in danger or need-of-help, as well as to spread urgent requests for food, water and tools.
However, one thing that became clear was how even well-intentioned actions don't always result in the best outcome. In some cases, tweets about collapsed buildings with "nobody helping" turned out to be false, but not before seemingly going viral and provoking an influx of well-meaning people into the surrounding area, causing traffic and additional chaos in the streets.
Similarly, many people continued to share and retweet requests for help more than 24 hours after the original message, when the situation on the ground would have been very different, potentially diverting valuable resources from where they were most needed.
How should we use social networks in these circumstances?
Mexico is one of the countries with the highest levels of seismic activity in the world. It is, unfortunately, inevitable that there will be another earthquake at some point in the future that is as bad as or worse than the one a week ago. Although we can't predict when it will happen, we can work on being better prepared.
All of the social media messages from the past week could provide an invaluable source of data for better understanding how people react to natural disasters, and enable us to answer questions like:
- What sort of things are people saying at different points in time following the event?
- What are the characteristics of messages that go viral?
- How do requests for help, supplies and tools change aand evolve over time?
Using this information we can begin to build better digital tools for use in future disasters, for example to coordinate volunteers and donations, or to prevent the spread of erroneous or outdated information.
With this in mind, last Thursday I started to download as many tweets as possible about last week's earthquake, specifically focusing on the first 72 hours up until Friday afternoon.
My specific criteria for the search were:
- Tweets containing particular hastags (e.g, #sismo, #SismoMexico2017, #ayudaCDMX)
- Tweets sent from or to key accounts(e.g, Red Cross, Civil Protection etc.)
The search took almost 4 days and resulted in a 50GB file containing 7.3 million tweets along with all of their metadata.
What can we learn from all of this data?
1. People took to Twitter just minutes after the earthquake occurred
In fact, in just 6 hours between 2pm and 8pm on Tuesday 19th September, more than 1.6 million tweets were sent, which is 23% of all of the tweets returned by my search.
Below you can see the hourly distribution of all of the tweets:
Note: The drop in volume on Thursday and Friday doesn't neccessarily mean people stopped tweeting about the quake; for example these tweets won't contain tweets with new hashtags that surfaced around those days
2. People used hashtags to give their tweets visibility
Out of the 7.3 million tweets, 93% contained at least one hashtag (although this isn't so surprising given that a key criteria for the search was a list of hashtags)
Among the top 10 hashtags, those referring to Mexico City were 3.5 times more common that ones about Puebla or Morelos.
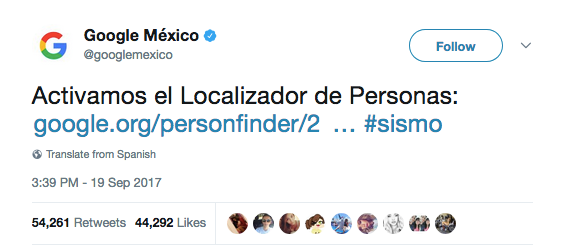
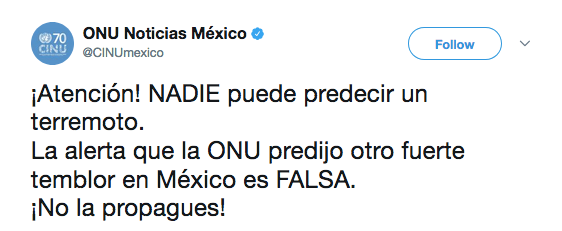
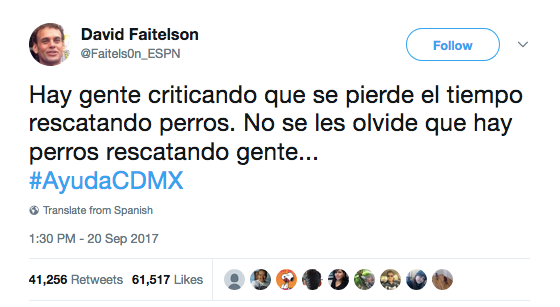
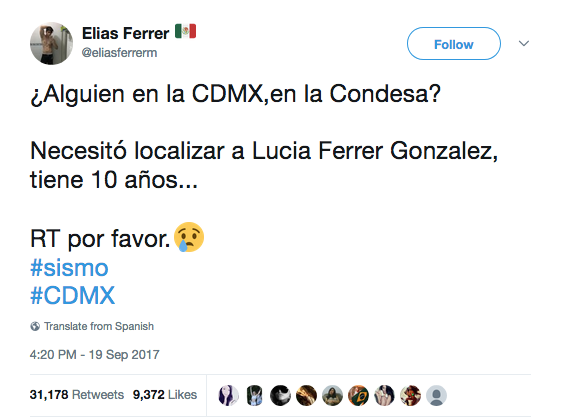
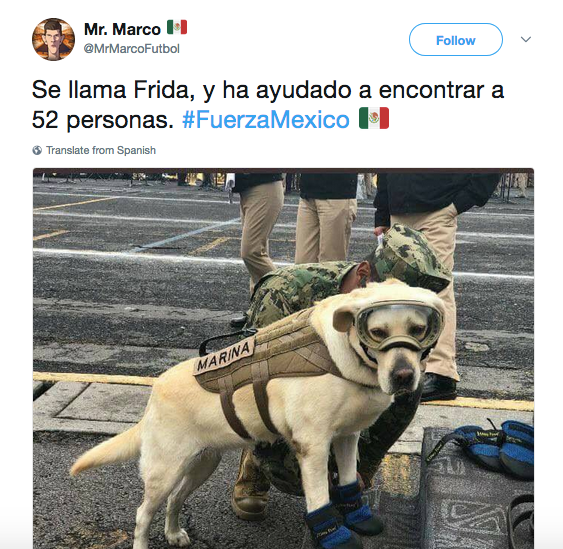
3. The most retweeted tweets included official updates, requests for help, and stories about dogs
4. People from all around the world were tweeting although, unsurprisingly, the majority were concentrated in Mexico City
Note: The map isn't representative of all tweets; only 3,939 of the 7.3 million twets (0.05%) had geographic metadata
5. The most commonly ocurring words were 'Mexico', 'people' and 'please'
6. The phrase "collection center" was by far the most common two-word pairing
Note:
Bigrams are pairs of words. In this case, prior to calculating frequencies, I removed stop words (i.e. the, and etc.) and converted words into their root form.
7. When people tweeted requests for help, they were typically asking for volunteers, (electrical) generators, help finding someone and for people to share information
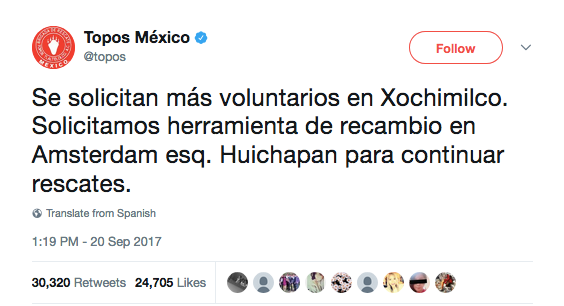
8. Tweets asking for volunteers continued to be shared more that 20 hours after the original message
As I mentioned earlier on, one problem, at least anecdotally, was people sharing outdated information.
We can get more insight into this by looking at retweets of messages like:
"More volunteers are needed in Xochimilo. We need replacement tools in Amsterdam / Huichapan to continue with rescue work.""
"We need lots of help in Viadutco / Monterrey, one block from parque delta, a lot of people have already left. Please RT. #Sismo #prayformexicocity"
"San Gregorio Xochimilco needs help. There are people under the rubble, volunteers and supplies are needed #AyudaCDMX"
In total, these three message were retweeted almost 34,000 times. In the chart below you can see that approximately 30% of the retweets ocurred more than 5 hours after the initial message.
Conclusion
These charts only scrape the surface of the insights we could obtain from this sort of data.
In particular, there are many natural language processing (NLP) tools we could use to analyze tweet sentiment, or to track in more detail the type of help requested at different points in time.
Nonetheless, its quite interesting to see the story of the earthquake told through tweets, from the intensity of tweeting activity in the initial hours, to the very human need to share 'lighter' things, such as all of the stories about rescue dogs.
One positive takeaway is the fact the the two most retweeted messages were a link to a Google tool for locating people, and a tweet trying to minimize fake news by reinforcing the point that earthquakes can't be predicted.
As a next step, I would focus on creating a tool for measuring the similarity between tweets in order to better identify false or out-of-date news in real-time.
This could be combined with a chatbot that can both keep track of newly emerging news, and also automatically respond to people sharing old information.
Search Criteria:
- Complete list of hashtags used: ayudaCDMX, fuerzamexico, sismo, SismoMexico2017, Sismomexico2017, AyudaMéxico, AyudaMexico, FuerzaMexico, fuerzaCdMx, cdmxsismo, Morelos, Puebla, MorelosEstaDePie, PueblaSigueDePie, PueblaEstaDePie, mexicoestadepie, Sismo, Rebsamen, ERUM, RescatePrimero
- Complete list of acounts used: SismologicoMX, SPCCDMX, PcSegob, SEGOB_mx, SeGobCDMX, VoluntariosErum, topos, MetroCDMX, SSP_CDMX, PoliciaFedMx, CruzRoja_MX
- The examples are numbers 1, 2, 3, 5, 7 and 8 respectively
- In order to analyze bigrams, I first eliminated common words (stop words), and converted each word to its root form using an nltk stemmer
- Prior to creating the chart, I attempted to convert stemmed words back to a more identifiable form ej., 'necesitar' en lugar de 'necesit'
- The chart doesn't include bigrams that are common names (e.g., Mexico City, Red Cross)
- I removed a couple of very similar / almost overlapping bigrams
- I started with certain base words: "urge", "necesitamos", "solicitamos", "requiere"
- Then, using the list of bigrams, I counted the most common words following the base words
- I elminated the following words from the final list: "ayuda", "apoyo", "crear", "urge" and "siguiente" given that they don't add much value, and I wanted to understand the type of help people were asking for