Applying NLP Methods to Tracking Refugees.
This is my first post in about 3 months, in large part because work got pretty crazy, but also because I have been spending a lot of my spare time on a Data For Democracy project focused on building a tool for tracking what are known as Internally Displaced Persons (IDPs).
Update: When I started writing this blog post back in May, we had just submitted our solution for consideration. Last week we received an email informing us that the Data For Democracy team had won first place, and that our solution would be implemented in some form by the IDMC team!!
The impetus behind this particular project was a competition run by Unite Ideas, on behalf of the Internal Displacement Monitoring Center, which is an independent, non-governmental organization dedicated to collecting and analyzing data about refugees and other people who have been ‘displaced’ from their homes.
The challenge, as I understand it, is that with hundreds if not thousands of news articles and other reports being generated every day, it would require a significant amount of manpower to be able to read each one of these in order to populate the database of internal displacement events on an ongoing basis.
This is (hopefully) where data science and machine learning can come to the rescue. The basic requirement was to create a tool that is capable of automatically “processing” news articles and other websites, and:
- Identifying whether or not they are about IDPs
- Classifying them into events due to Natural Disasters vs. Conflict or Violence
- Extracting key information such as the number of people affected, location, date etc.
- Providing tools for analysis and visualization of the data
During the rest of this post I will talk a little bit about our solution and the different approaches to fact extraction as well as some reflections on my own personal experience of working on the project.
Brief Overview of the Solution
For those readers interested in the technical side of things, the solution we created consists of a Python back-end and NodeJS front end, interacting through a PostgreSQL database, all nicely wrapped-up in a Docker container.
Back-End
The back-end is basically a collection of modules that facilitate and support article processing, classification and information extraction. This all comes together in a ‘pipeline’ function that can be given a specifc URL, and then carries out the following steps:
- Try and figure out if the URL links to a PDF file or regular web page
- Access the URL and extract the content along with relevant metadata (e.g., publication date)
- Assess the article relevance (i.e. decide if the subject matter relates to IDPs)
- Further classify relevant articles into three types: Natural Disaster, Violence or Other
- Extract key facts about the event (more on this in a later section)
- Identify locations mentioned in the text and further obtain the specificy country name as well as latitude/longitude coordinates
- Save everything into a database for later analysis and visualization
Some of the principles that we seem to have stuck to during this project, for better or worse, are to base ourselves around Python3, and to use 3rd party libraries wherever possible to speed things up and make our lives easier. Thus we have ended up with a pretty extensive ‘requirements.txt’ file, however some of the more notable libraries we used are:
- Newspaper for parsing and extracting text and metadata from webpages
- Spacy, Textacy and Gensim for Natural Language Processing work such as tagging, tokenizing, Part-Of-Speech extraction etc.
- Good old scikit-learn for our (pretty basic) machine learning models
We also took advantage of mapzen.com’s Geocoding API which provides extensive and well-structured information for place names, including the underlying Country ISO code which was a key piece of data we needed to obtain.
Front-End
The front-end was started much later in the project, and so does not (yet) include all of the visualizations and other functionality we want to provide, however the idea is that this will be the access point for analysts and other users, where they should be able to:
- Filter events based on dates, locations and event type
- Create different types of visualizations of the number of displaced people / destroyed houses etc.
- Submit new URLs to the database for later processing
Report Extraction
Before getting into the nuts and bolts of the approach, it is worth explaining in a little more detail what is meant by a report.
For those articles that are deemed to be about IDPs, the solution needs to be able to generate a summary of the type of event, where it happened, the number of people or houses impacted etc.
For the purposes of this competition a report requires a number of facts to be present, including:
- The date of publication of the underlying article
- The location where the displacement event occurred
- The reporting term used in the article (i.e. Displaced, Evacuated, Destroyed Housing etc.)
- The reporting unit (i.e. People. Residents, Families, Households etc.)
- The displacement figure, that is the number of people or households affected
Initial Approach
When we started, there was no training data or other examples available, and so we began with a rules-based approach to fact-extraction, with the rules slowly being built up by manually reviewing performance on a small selection of articles and examining the fail cases in detail.
A very simple and naïve rule could be to look for the occurrence of the right words within a sentence or paragraph. For example, you could look for co-occurrences of “People” and “Displaced” in order to identify reports.
If you are able to come up with an exhaustive list of the keywords, then this sort of approach should be able to correctly identify relevant articles (high recall), however it is also likely to find a lot of irrelevant articles too, that just happen to contain some of the keywords (i.e. low precision).
Instead we tried to fashion a series of rules that don’t just look for keywords, but also attempt to ensure that they have the right grammatical or contextual relationship between them.
Here the first step was to use Spacy to process articles and look at how the different terms are related to each other within sentences. A very useful tool is displacy which provides a nice online visualization of the syntactic structure of a text fragment:
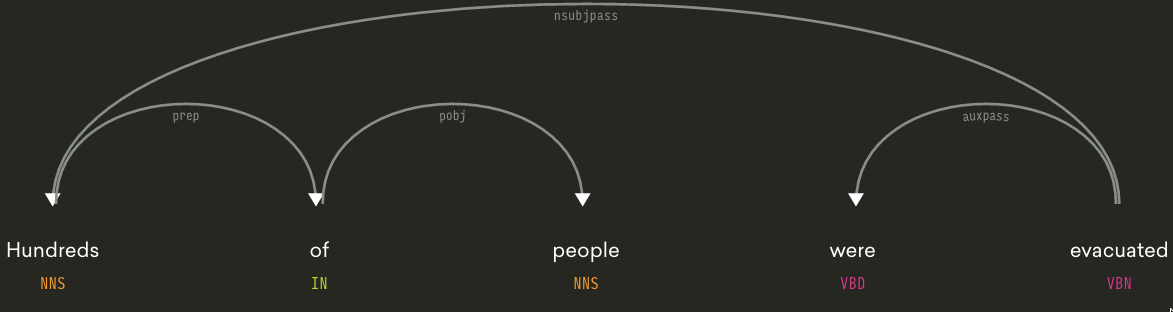
Initial inspection seemed to indicate that Reporting Terms (i.e. Displaced, Evacuated) typically occur as verbs in a sentence and Reporting Units (People, Houses etc.) can either be their subject or object.
Thus a very simple rule could be based on finding those sentences that have a word like People or Persons as the subject, and a word like Displaced or Flee as the verb.
If a sentence seems to contain a report based on these rules, then we can start looking for other pieces of information such as numbers, dates and locations by using Named Entity Recognition.
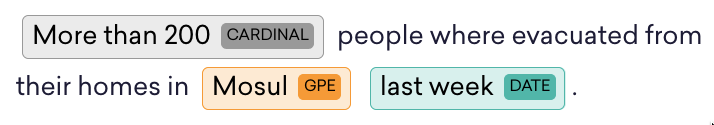
Spacy has pretty good Named Entity Recognition functionality, and also provides another useful online tool for visualizing the different types of entities found within a sentence.
For example, in the sentence below, the tool highlights relevant parts of text that are:
- Numeric (for identifying the number of people affected)
- Place names (for identifying the location of the event)
- Dates (for identifying when the evnt occurred)
It is worth noting that at this point we were approaching the problem in as general a way as possible, aiming to identify all possible references to displaced people in each sentence, paragraph and article, while also trying to build up a highly comprehensive list of relevant vocabulary, rules and keywords.
Machine Learning + Rules
Once we got close to the competition submission deadline, we discovered that in the tool would be evaluated in a much more constrained fashion than we had previously imagined.
In particular, in order to test the fact extraction capabilities, we would be provided with a selection of sentences or sentence fragments and have to return the model output along certain dimensions.
In some cases this amounted to basically being a classification exercise where we would need to choose between certain categories in terms of the reporting unit and reporting term from a list of pre-defined options.
Meanwhile the quantity of people affected as well as the location continued to present a challenge, as the model would need to extract these directly from the text.
We had a small set of training data to work with consisting of about 130 tagged text excerpts, although this was pretty noisy, for example:
- Many sentences were ambiguous with both people and households being mentioned
- Multiple locations were often mentioned in the text
- Some excerpts were tagged with a location, despite no location being mentioned in the text
However, we decided to go ahead and try and build a small machine learning-based model to help complement our initial rules-based approach.
Final Submitted Model
The final model included in the submission was based on a mixed approach combining the output of the handcrafted rules and machine learning models.
For both the reporting unit & term, we used a simple set of rules to combine the two approaches:
- If the classifier and rules output match => Done
- If the handcrafted rules do not find anything => Use the classifier output
- Otherwise => Use the rules output
The Reporting Unit classifier was a Multinomial Naive Bayes model trained on features extracted using scikit-learn’s Word Vectorizer (single words).
The Reporting Term classifier meanwhile combined two separate models:
- A Multinomial Naïve Bayes model trained using Word Vectorizer bi-grams
- A Linear SVC trained on a feature array extracted using a Word2Vec model (from Google)
The F1-score improvement from combining the rules + classifiers was:
| Rules | Classifier | Combined | |
|---|---|---|---|
| Reporting Unit | 0.73 | 0.88 | 0.93 |
| Reporting Term | 0.68 | 0.58 | 0.71 |
Note: Report Extraction was not the only area where we ended up using Machine Learning, and in fact the team leader, George Richardson, also created several classifiers for other parts of the process, specifically identifying relevant articles and classifying them into Natural Disaster vs. Conflict & Violence. However, I was not particularly involved there and so have instead focused more on the models that I worked on.
Future Work
When we submitted our solution we certainly didn’t feel it was complete and had already identified a number of improvements to work-on across the board, including:
- Making improvements to both URL and PDF parsing, especially dealing with URL retrieval errors and timeouts.
- Creating and implementing new visualizations and ways of aggregating and presenting the underlying data
- Making improvements to our Machine Learning models, in particular by obtaining more training data using some credit very kindly donated by the folks at Crowdflower
- Starting to work on new metadata fields for articles and reports with the aim of being able to score the extracted content in terms of reliability and report accuracy.
Personal Reflections
When I started writing this post, I coincidentally also listened to a Partially Derivative podcast where Chris Albon talks about “Learning Everything Else”, i.e. the non-Data Science parts of being a Data Scientist.
One of my motivations for getting involved in this particular project was the opportunity to learn about and work on Natural Language Processing techniques, and while I certainly got to do that, I also feel that I got as much if not more value from the “everything else”.
For example this was my first experience of doing data science as part of a team, and it was a fantastic demonstration of how much more you can achieve by collaborating with other people. I learned a huge amount through those interactions, and I would never have been able to achieve so much if I’d had to do everything myself.
It also turned out that our team was spread across the world with people in Seattle, Florida, England, Australia and Mexico, to name just a few of the locations. I therefore had to learn and get very comfortable with Slack as the only channel for communication as well as using Git and GitHub collaboratively.
Finally, a significant proportion of what we had to do was more software engineering rather than pure Data Science. Ultimately we were trying to deliver a tool that could be useable in the real world, and hence spent a lot of time thinking about modules, pipelines and data models.
This is not to say that I am now an expert software engineer, but I certainly feel the experience I gained in that regard was as useful as what I learned about Natural Language Processing.
Links
Internal Displacement Github repo
Submitted solution website
Winning Announcement
Data For Democracy website