Traffic Modeling Part I
One of my personal projects for the beginning of this year was to get more comfortable with Python in preparation for (maybe) doing a Data Science course of some kind. However I knew that just trying to work through theory wouldn’t be very effective, and instead wanted to play around with an actual problem as a learning device.
So, a few weeks ago when I was stuck waiting at a particularly bad set of traffic lights near my house and thinking about how bad the timing seemed to be, I hit upon an idea for doing something in Python: modeling the behavior of traffic at a traffic light.
Quick disclaimer: the only thing I really wanted to achieve was to improve in Python, so I make no claim as to the accuracy of any models, assumptions or results when it comes to actual traffic.
Model 1: Single Car arriving per interval
The first version of my model was a very-simple one, looking at single cars arriving at a light during 1-minute intervals and calculating the average car waiting time.
I created a simple TrafficLight class with two basic properties:
- greenTime being the number of seconds the light is green
- redTime the number of seconds the light is red
and for simplicity I assumed that greenTime + redTime = 60
I modeled car arrival time as a Uniform random variable on [0,60] (i.e., each individual car is equally likely to arrive at any time during the minute interval.)
I ran simulations for greenTime starting at 0.6 seconds, and in increments of 0.2 seconds (up to 59.4), and for each greenTime calculated the average for 20 independent car arrival times.
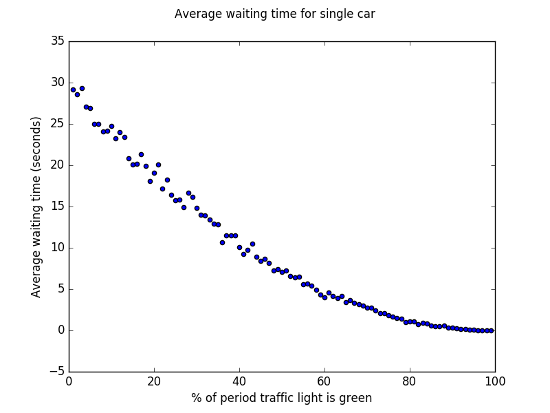
The results are not that surprising. When the greenTime % is low, then the average wait time is around 30 seconds. We would expect this because the total redTime is approximately 60 seconds, and the expected car arrival time is at 30 seconds, so on average each car would be likely to wait 30 seconds before the light turns green again.
Similarly, we can see that when the green/red proportion is 50-50, the average waiting time is somewhere between 5 and 10 seconds. In this case, we would expect half the cars to arrive between 0-30 with a wait time of 0, and half to arrive between 30-60 with an average wait time of 15 seconds, leading to a global average of 7.5s.
Finally, when the light is green nearly all of the time, the average wait time is around 0 seconds, again as we would expect.
Model 2: Multiple cars arriving per interval
Here I move on to a more complex case where multiple cars can arrive in a given 60-second interval.
I model cars arriving as a Poisson Random Variable, and again look at average car waiting time based on three variables:
- Car arrival rate: Between 2 and 38 per minute
- Green time proportion: % of 60-second interval traffic light is green
- Car pass rate: the number of cars that can pass the light per second when it is green
First we plot car arrival rate vs. average waiting time, for different values of the greenTime percentage.
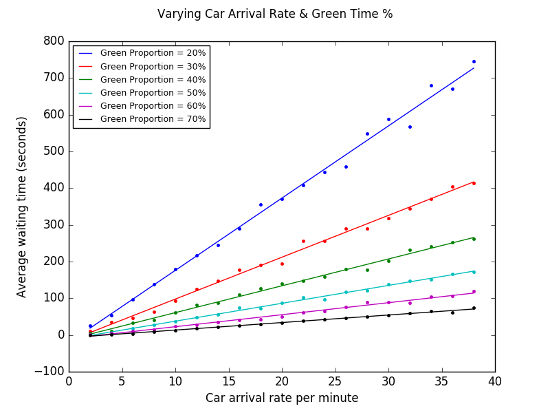
Again the results are not so surprising. As the car arrival rate increases, the average wait time increases, with the gradient determined by the % of the interval for which the light is green.
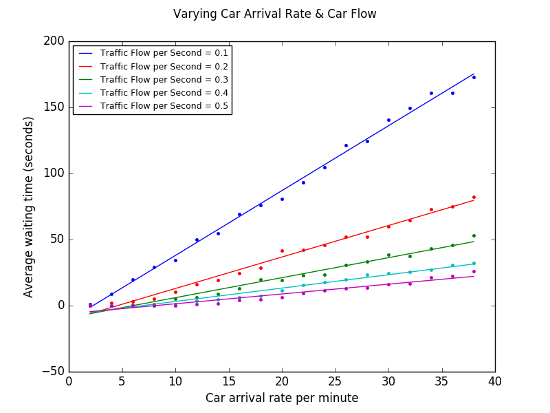
The picture is pretty similar if we vary the value of car pass rate instead of greenTime %, although with different gradient values.
Model 3: Multiple cars arriving per interval + blocked junction
For the next iteration, I took Model 2 and added in an extra factor: junction blocking.
From personal experience (where I live), I have seen that in heavy traffic (i.e. high car arrival rate), traffic junctions can often become blocked as cars either remain stationary across the junction when their light turns red, or continue to pass after the light turns red and hence end up blocking the oncoming traffic.
I model this using a blocking probability, p, so when cars arrive at the light then with probability p, the junction is blocked and so even if the light is green, then all cars must wait for the full 60 seconds (greenTime + redTime) before they have the possibility of advancing (or again being blocked with probability p).
In this example I assume that if the junction is blocked, then the block lasts for the full greenTime.
[Note: in both Models 2 and 3, I am assuming that all the cars arrive at the start of the 60 second interval.]
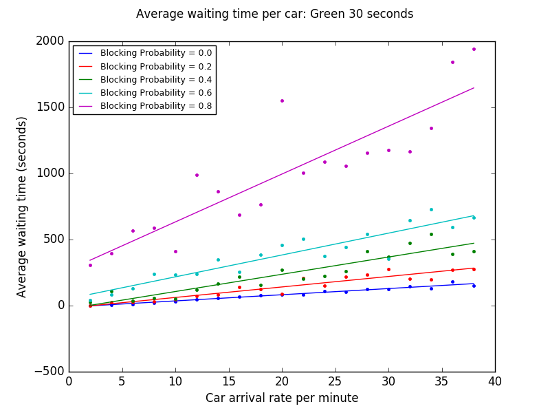
Here we plot Average car waiting time vs. Car arrival rate for different values of p, the blocking probability, all for the case where the light is green for 30 seconds.
As we would expect, average waiting time increases substantially as the probability of the intersection being clocked increases, but also variability in waiting time (around the best fit line) also increases quite dramatically.
Model 4 Part I: Minute-by-minute simulation
In the next iteration, I looked at a minute-by-minute simulation over the course of a one-hour period.
The rough procedure for each one-minute interval is:
- Simulate new number of cars, X, that arrive and join the queue by drawing from a Poisson distribution
- Calculate the number, Y, of cars that pass the traffic light based upon traffic conditions
- Calculate the average wait time for the cars passing in that period
- Update the ‘new’ queue of cars to reflect the situation after that period.
I also modified some of my assumptions regarding the traffic flow:
- The rate at which cars can pass a green light decreases as the traffic gets heavier – based on personal observation, what I see is that the heavier the traffic, the more people try and do things like cut across lanes at the last second to turn etc., and so overall everyone advances more slowly
- The probability that other cars block the junction on a green light also increases with traffic density: again in heavier traffic, it is more likely that cars will end up blocking when their corresponding light turns red
- If cars do block the junction, then it is not for the whole of the green-light period, but for a varying proportion of time
In this model we use a new model, Car, with a waitTime property to keep track of how long each cars waits before it passes.
I defined three types of traffic conditions, Light, Medium & Heavy as follows:
Light Traffic:
- Car arrival rate: 8 cars per minute
- Car pass rate: 1 car per second when the traffic light is green
- Blocking probability: 0.05
- Blocking time: 5% of the green light period
Medium Traffic:
- Car arrival rate: 12 cars per minute
- Car pass rate: 0.9 car per second when the traffic light is green (90% of normal rate)
- Blocking probability: 0.2
- Blocking time: 20% of the green light period
Heavy Traffic:
- Car arrival rate: 20 cars per minute
- Car pass rate: 0.72 car per second when the traffic light is green (72% of normal rate)
- Blocking probability: 0.45
- Blocking time: 50% of the green light period
I divided the 60 minute period into five different sub-periods:
- 5 mins of Light traffic
- 15 mins of Heavy traffic
- 20 mins of Medium traffic
- 15 mins of Heavy traffic
- 5 mins of Light traffic
For each 1-minute period the program adds a new number of cars to the waiting queue, based upon the arrival rate, and uses a runTraffic function to:
- Model the probability that the intersection is blocked
- Calculate the number of cars that can pass
- Update the wait time for each car that passes
- Calculate the average wait time for the cars that passed in that period
- Remove the passed cars from the queue
- Update the wait time for each of the cars still in the queue
Note regarding waiting times:
For each minute interval, for the cars that do not pass the light, we add 60 seconds to their total wait time.
For cars that do pass the light in a given interval, I originally added 0 seconds to their wait time, effectively assuming that once the light turns green all cars that are going to pass do so immediately.
However this assumption is not realistic, and so I changed this by dividing the light greenTime by the number of cars that pass, taking into account any blocking time, and assuming that these cars pass uniformly in that interval.
Finally, I run the simulation 1000 times and look at average results per minute for
- Number of cars still waiting in the queue
- Number of cars passing per minute
- Average car waiting time
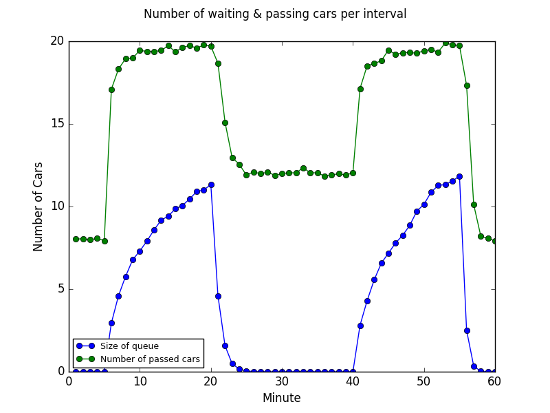
Regarding the size of the traffic queue, unsurprisingly we see the number of waiting cars around 0 when the traffic is Light or Medium and pretty much all cars are able to pass in the given time, and the size of the queue steadily increases to a maximum of around 12 or 13 cars in heavier traffic.
In terms of passing cars, we see fairly steady (but different) pass rates in each of the traffic conditions, plus a little bit of noise being generated by the blocking probabilities.
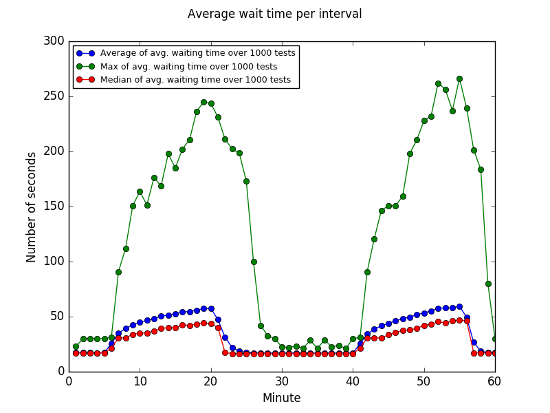
If we look at the average waiting time per period, defined to be the average wait time for the cars that make it past the traffic light in the minute, we see large variability. In Heavy traffic conditions, in some of the simulations, the average waiting time reached nearly 600 seconds, whereas the average and median statistics across all of the simulations are much lower at around 50 seconds.
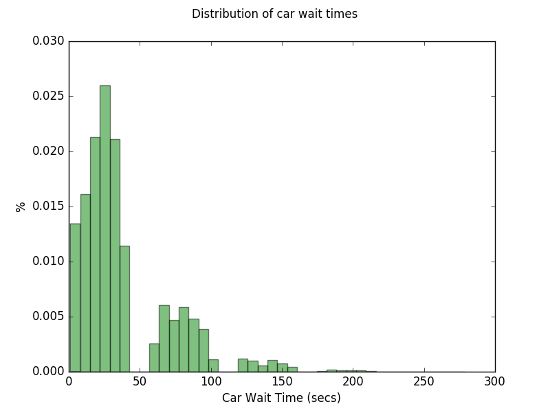
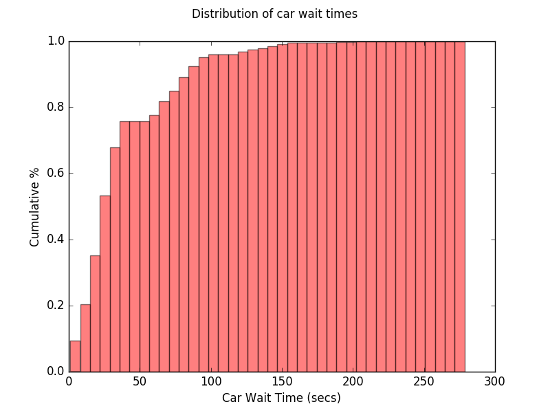
We can get a better picture of what is going on by looking at the distribution of waiting times across all cars, and it turns out that about 75% of cars wait for less than 50 seconds, 20% wait for between 50 and 100 seconds and less than 5% wait for more than 100 seconds.
In a subsequent post I will explore two further improvements:
- Simplifying the structure of Model 4 by introducing new classes
- Creating a second-by-second simulation
Code is at: https://github.com/simonb83/traffic